

Naturally, business owners look for justification when investing their money in marketing. Clients who are not familiar with web marketing at a basic level can be hard, if not even impossible to please. I always ask my clients for the short and long-term goals to set realistic expectations. I use this as an opportunity to explain the right way of measuring marketing success.
Progress Signals & Conversion Goals
I think of progress signals as the bright light illuminating from a lighthouse at a distance. When your signals illustrate a positive trend, you know that you are in the right direction. Otherwise, you steer left/right to realign to your destination.
Impressions, CTR, traffic, and of course keyword rankings are all examples of progress signals. I cover this and why keyword ranking is only a progress signal and not a success metric further in this post.
Conversion goals are a success metric. Different from progress signals, success metrics are actual proof for return – when setup correctly. This is a common roadblock many encounter. They either set up goals incorrectly, or worse, don’t set up any at all.
So What Makes a Good Conversion Goal?
Conversion goals are really a form of engagement. Goals are not always a business’s final desired result (e.g. a purchase, phone call, etc.). For example, it could be a variety of actions a visitor completed that brought him closer to the end of the buying funnel. A good conversion goal is always tied to a meaningful user engagement action, such as:
- Request a demo
- Buy
- Subscribe
- Send form
- Download
- Phone call
Other conversion goals (with lower engagement):
- Page views
- Spent X amount of time on the website
- Landed on a specific URL
NOTE: The second group of conversion goals indicates lower engagement. Nonetheless, they are still considered good indicators of early signs of engagement. For this reason, low engagement conversion goals can also be used as progress metrics. Later in the post I explain more on how to use them.
The Misconception of Success Metrics (Goals)
There is an obvious correlation between goals’ completion to sales trends on e-commerce websites. However, for businesses with offline transactions, proving improvement is a bit more complex. This requires a different route altogether. Let’s examine the following two scenarios:
Scenario One:
WildFae is a clothing company that makes on average 155 sales per day. They hired a new web marketing specialist to help improve conversions performance. After looking over last quarter sales’ stats, the daily average bumped to 201 transactions. At this point, it appears that the 30% increase in sales suggests success.
Scenario Two:
HomeAppFinder is a real estate company. They set up many call tracking numbers on their website to monitor all incoming leads. A new web-marketing specialist has been hired to help improve conversion performance. Reviewing last quarter sales’, stats revealed sales doubled. At this point, it appears the increase in sales suggests success. Both scenarios seem great! Yet, we can’t assume success is due to the new marketing activity.
I’ll explain. The above scenarios draw a very positive picture. However, what if the situation was the opposite where sales have stayed the same or even dropped? That would surely put the newly hired under the spotlight. Sounds familiar?
In the 1st scenario, sales are used as the only indicator for success. Without setting up progress signals, success can’t be accurately tracked. For example, it could have been that the company was just lucky to have a better quarter that year. Maybe a result from outside factors, like an unrelated viral nationwide TV commercial.
The commercial could have made a certain product popular for WildFae prospects. Failing to track a peak in sales and just taking credit could end up hurting you in the long run. It would be a disaster if average sales go back to normal after a few months, and you don’t have a clue as to why. Control metrics along side conversion stats make reporting more aligned to what’s going on. The correlation between the two confirms or invalidates both good and bad performances. This really reflects the hard work you do.
In the 2nd scenario, the business owner reported back double the sales. Here we are using sales again, and truth be told, it is the business’s bottom line. Yet, it couldn’t be more of an inaccurate indicator for marketing operation success. Especially in this type of business where the actual sale is off the website. (Ex: Condo sales in Calgary Canada went up thanks to better salesmen performances). Conversions should be redefined to stay within the website! If we don’t have control over conversions, we cannot accurately measure and improve them. This scenario could easily have been the opposite where sales plunged. So what kind of conversions can then be set for sales that happen offline? In this case, conversions should be based on phone calls and/or contact forms.
The solution is to use progress signals stats alongside accurate conversions data.
Reading & Reporting Your Progress Signals
By now you probably get a better picture of setting up goals and progress signals. It is not just about adding a Google Analytics code to the contact us button, etc. You can use a software program that is already aligned with this methodology, or simply use Excel spreadsheets like I do in the examples below.
Okay, let’s review some of the useful data you can get from progress signals. Afterward, I will tie everything up with goals setting.
Impressions as Progress Signals
Since an impression is a pre-engagement metric, many take it lightly. Record impressions data on a monthly basis. This will serve as your control metric to recognize severe abnormalities. I’m referring to organic impressions. They can be found in your Google Webmaster Tools account -> search traffic -> search analytics tab.
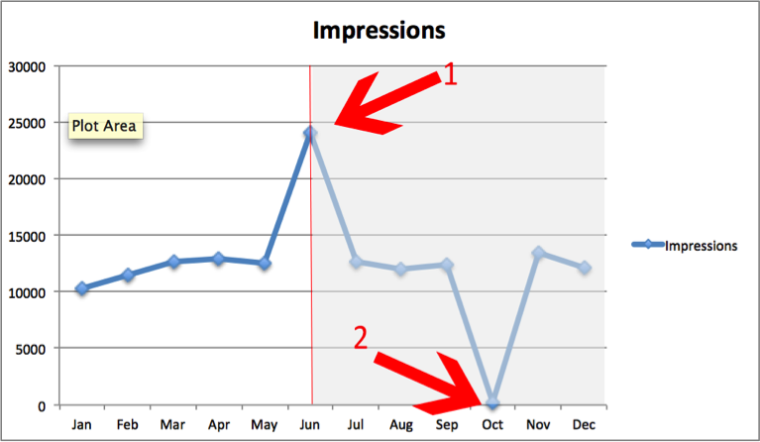
At the time of point one (Jun), we wouldn’t have known which direction the increase of impressions was headed.
If you had significant keyword ranking improvement, you probably expected an inclining trend. We know that this is not the case (see image). The drop could have been from a significant and sudden increase of new pages on your website.
- If you added these pages; good. Just make sure they contain quality information. This will avoid hurting your CTR, page views, bounce rate, etc.
- If you didn’t add these pages, you should check to see if someone else did (hacker). Also, check to see if those are hidden URLs you don’t know about.
Point number two (Oct), shows the opposite – a significant drop. This could have been the result from a penalty and/or devaluation. If it’s temporary, it could have been an algorithm update that was rolling out and caused a temporary drop. It could also have been a large amount of URLs being updated on the website (ex: if you went through a website redesign).
Sign of a positive trend: an increase in impressions overtime with a steady or growing CTR. This is a firm progress signal indicating that you are steering in the right direction.
What to report: impressions’ trends and abnormalities.
CTR as a Progress Signal
Periodically, updating your site’s descriptions and ad copies can help you improve CTR. However, the real problem with CTR is poor content optimization. this makes websites less relevant and show up for phrases not wanted. Here is a good post that talks more about page optimization by the Wizard of Moz.

CTR naturally fluctuates, and for every traffic source it is different. Making sure you are in the right normal range is already a start. Afterward, you can improve CTR overtime. CTR growth outside of the normal zone can be due to a marketing strategy. For example, informational content or content that over-appeals emotionally on your website. These types of ads/descriptions create more curiosity than anything else. As a result, they may bring you high CTR but not necessarily prospects ready to buy.
Sign of a positive trend: an increase in CTR over time with steady or growing conversions.
What to report: CTR growth over time within the normal range.
Traffic as a Progress Signal
When reporting traffic trends, you could probably get away comparing current to previous months. Only, of course, if your client’s business is not seasonal. However, if your client sells women’s swimming suits, you must report comparing the current period to the same one in the previous year.

Point one – In this table, is traffic really going down? No – there is a significant improvement despite the decline you see from March to July 2015. This business must be seasonal, you say? You are absolutely right! Here, we measure improvement based on the delta comparing one month in 2014 to 2015. Do you see the increase?
Point two – here you can see the correlation between the two years. An incline in August was expected.
Sign of a positive trend: when the current period you measure exceeds the previous one. Also, when the graph lines keep moving away from each other (positive delta).
What to report: fact – all businesses are seasonal on some level. Always report traffic comparing current period to the same one the previous year.
Keyword Ranking as a Progress Signal
You can find many reasons why many SEOs abandoned keyword scraping inthis article by Megan Marrs. If you are still checking your ranking every day/week/month, it is useless. Ranking checking tools are simply blinding you. There are thousands of terms you are already ranking for which you can improve and learn from. No need for fancy tools or expensive processes. Simply log in to your Google Webmaster Tools and find all the information you need:
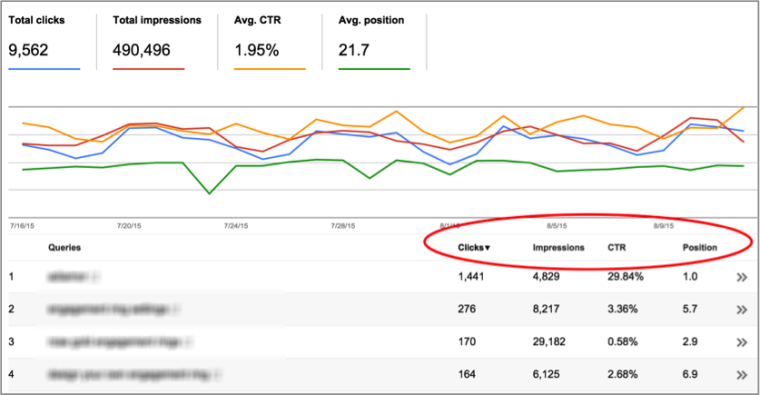
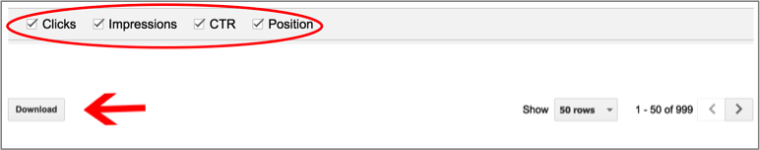
Ditching keyword scraping will leave you with more time for real optimization action. You can focus on user experience, relevancy, and conversions. To start, download all the terms you are ranking for from Google Webmaster Tools. Go to search traffic -> search analytics -> check all data options for queries -> and click download.
A few more steps to go:
- Make a list of 3-5 short terms you want to improve visibility for
- Search for and color all the cells containing your terms
- Move all the rest to a separate list
The list with all the colored keyword cells are your “to dos”. Ask yourself how can you improve each metric to increase visibility. I admit – it’s a lot of data, and could be overwhelming, but also a huge eye-opener!
The list of remaining terms will contain either brand phrases, informational phrases, or unrelated. I like to take all the informational terms (how, who, where, why, when, best, and top) and create a list of relevant blog posts. You’ll be surprised at how fast you can rank for these easy low hanging fruits.
Sign of a positive trend: more relevant terms join the list. Overall keywords’ metrics are improving.
What to report: the number of phrases you found corresponding to the 3-5 core keywords. Provide keyword level stats on this growing list of phrases and on how these metrics improve over time.
Pageviews and Time on Site as Progress Signals
As I previously mentioned, page views and time on site can be considered both conversion goals and progress signals. As progress signals, we record that number monthly and compare it to the same month the previous year (just like we did with traffic).
Sign of a positive trend: an increase in page views and time on site over time. This suggests website content improvement. Remember, an increase means a positive delta between the current month to the same one last year.
What to report: all businesses are seasonal on some level. Always report page views and time on site comparing current period to the same one the previous year.
Wrapping Everything Up With Conversion Goals
I report progress signals and success metrics to my clients. This is a good way for them to see improvement not just in the bottom line, but also on the way getting there. Web marketing is not a tangible but rather an ongoing process. Why not get credit for the work you do before entering the performance zone? I always share this graph with my clients. It illustrates the timeline and hard work it takes to bring a website to perform.

- The green line separates the performance zone in yellow and the pre-performance zone in gray.
- The purple graph line marks progress signals and conversion stats growing over time.
- When the purple graph line meets the green line, the business starts to see return. The higher it climbs, the better the campaign will perform.
Think about it: if you setup an email marketing campaign, SEO plan, or social media strategy, will it work immediately? No, it takes time to do all preliminary work and for things to get the traction they need to yield results. What do you answer a client that asks you why he doesn’t see any sales increase after the first 30 days? Use this generic graph to set expectations before you even engage.
The Y-axis on the graph represents progress signals and goals. I set goals to be realistic, and I make sure to always set more than one.
Let’s use an e-commerce website as an example. Besides a purchase/buy completion goal, I might have a newsletter subscription goal. I might also have a catalog download goal. For an informational website, I would set up goals differently. I could have phone sales leads, a contact us form submission, and/or page views as goals.
For online retail where purchases are conversions, do the following:
- Set your main conversion goal to be purchases.
- Set at least one secondary goal (ex: newsletter subscribe). By having a secondary goal(s), one, you’ll be able to get more out of your website. Two, it will serve you as a control metric to recognize conversion goal abnormalities.
- Periodically collect progress signals data (impressions, CTR, traffic, keyword ranking) and report back. This will help accurately prove work performance. It will also give you an in-depth understanding of the campaign(s) status.
For informational websites where business transactions occur offsite, do the following:
- Set your main conversion goal to be phone calls.
- Set at least one secondary goal (ex: contact us form). By having a secondary goal(s), one, you’ll be able to get more out of your website. Two, it will serve you as a control metric for recognizing conversion goal abnormalities.
- Periodically collect progress signals data (impressions, CTR, traffic, keyword ranking) and report back. This will help accurately prove work performance. It will also give you an in-depth understanding of the campaign(s) status.
Conclusion
Keep the control in your hands. Don’t be tempted to measure performance by only looking at gross sales. This is a common mistake and an inaccurate way to measure progress and campaign success. In addition to goals, provide your client progress signals data. This will help justify the work you do and keep your clients informed.
Set expectations when explaining about the performance zone and the lag time. This is one of the best ways I’ve found for my clients to give a fair chance for campaigns to grow. Also, it avoids frustration after just one month.
The importance of analyzing and reporting is strongly reflected throughout this article. You can create your own method, or are welcome to use mine as explained above. It has worked for me for over a decade now.
[“source-searchenginejournal”]
