

When it comes to free analytics software, nothing comes close to Google Analytics.
Over 28,365,107 sites use it, which makes it the most popular analytics solution on the market.
Although it has some limitations, it’s fantastic as a free product.
However, most webmasters see the basic graphs and stats that Google Analytics (GA) gives you and never dig any deeper.
This is a shame because there are some really useful advanced features just waiting for you to be used. And I’m about to show you what they are.
And although they’re advanced, they aren’t complicated to implement or use. I’m going to break them down step by step in this post, and I encourage you to start using as many of them as you find useful.
1. One Goal is Nice, but Two is Better
Too many website owners focus mostly on traffic.
But traffic is just a vanity stat. What really matters is conversions.
It doesn’t matter how many people you can get to visit your site if you can’t convince many to subscribe or buy from you.
As a marketer, you can do many things to try to improve your conversion rates. But they all require tracking your conversions to see if you were able to produce a statistically significant improvement.
In GA, conversions are called “goals.” Goals are specific actions that visitors take on your website that you’d like to track.
Setting up a basic goal: Goals are limited because you can track only a few specific options. If you need more customized options (e.g., clicking a specific link), I’ll show you how to do that with another trick later on.
What goals are typically best for is to track when a visitor loads a specific,exclusive page, like a thank-you page after signing up for an email newsletter.
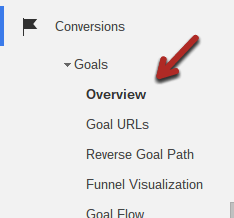
To start, go to the “Conversions > Goals > Overview” tab at the very bottom of the left-hand menu:
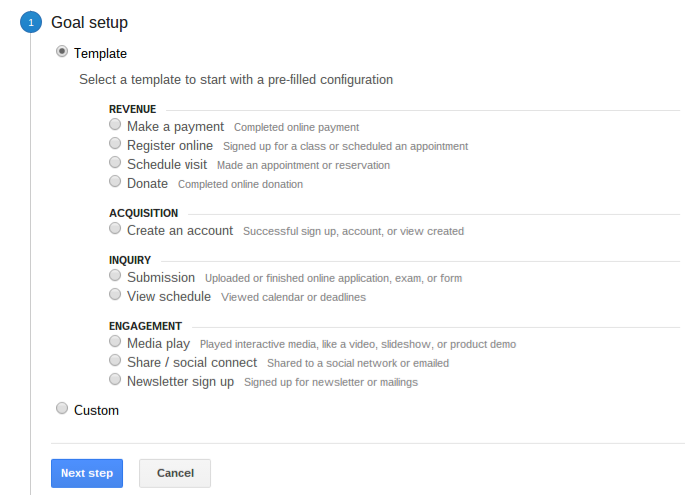
Next, you can choose which pre-filled template you’d like to use. This will narrow down the fields you need to fill out in the final steps:
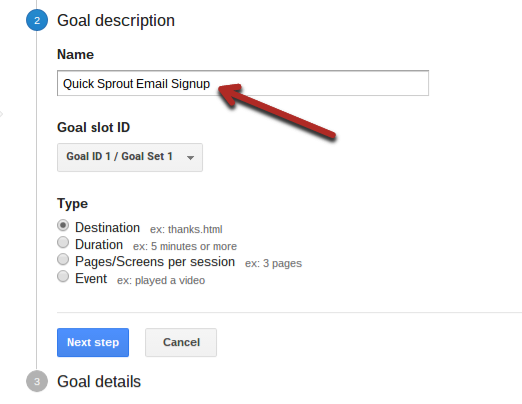
Once you click “Next Step”, you’ll get a chance to give your goal a name. This will show up later in your analytics, so pick something that is descriptive.
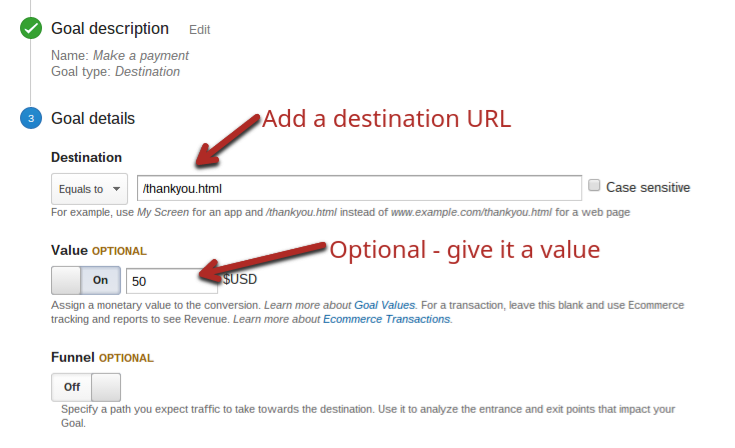
One last step is to put in the page or metric you’d like tracked.
In this case, it’s a URL of a thank-you page that visitors can access only after signing up to a newsletter (it automatically redirects them to it).
You can also add a value for the goal. If a subscriber is worth $50 (hypothetically), you can type that in. It will show up in your tracking later on, and you can use it as a quick estimate of your income over a time period.
Once you click “Create Goal”, you’re done.
You won’t have any data at the start, but after a few days, you’ll see a graph like this:
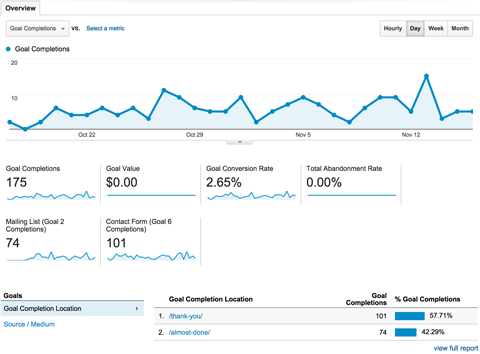
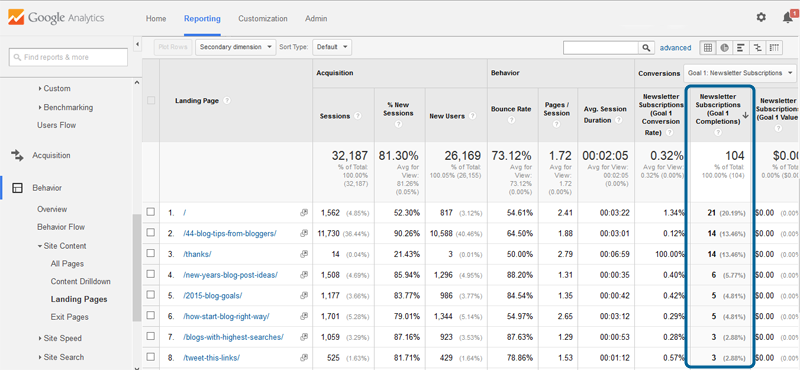
In addition, you can go to almost any report in GA and see a column for your goal. For example, you can see how well traffic converts based on its landing page:
Take conversions further by setting up multiple goal tracking: What do you do when you want to track a specific goal, but there are multiple ways for a visitor to accomplish it?
For example, you may have different email lists that users can join, so they have separate thank-you pages tailored for each specific list.
You could create two separate goals, but in many cases, you’ll want to combine them into a single “email signup” goal. It’s pretty simple to do.
Create your goal just like you normally would (above), but when you get to the final step, choose “regular expression” instead of “equals to.”
This allows you to use regular expression statements to create a goal that matches multiple pages.
For example, if I had two destination pages after a user signs up:
- /thank-you.html
- /download
I would enter:
/(thank-you.html|download)$
As shown below:
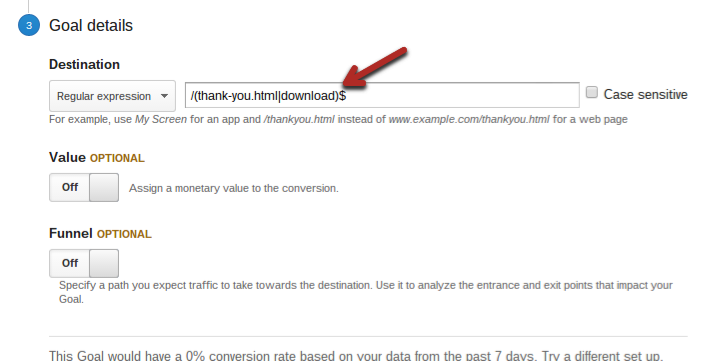
If you’re not familiar with regular expressions, the vertical line (“|”) represents an OR statement. Essentially, it’s saying that if the URL matches a value on either side of the line, it should count as a goal. The brackets are needed to identify where the different options start and end.
Finally, the dollar sign signifies the end of the regular expression. In this case, it wouldn’t matter, but if you had multiple URLs that contained “/download”, you would use it to avoid counting other pages as well.
2. Understand Your Effectiveness with Event Tracking
Readers click on a lot of things when they visit your website.
One way to track their actions is with heat mapping software, but GA also has a few useful features.
An event is typically a click.
With event tracking, you can track how often readers are clicking a specific link or element. Most commonly, it is used to track:
- file downloads
- link clicks
- embedded AJAX page elements interactions
- Flash movie (or element) plays
This is useful to see if visitors are actually clicking on a specific link or element that you add to a page.
The good news is it’s relatively simple to do once you understand it.
Here’s what the basic form of event tracking code looks like:
_trackEvent(category, action, opt_label, opt_value, opt_noninteraction)
That’s going to mean absolutely nothing until I define the terms in brackets there:
- category – the type of event you are clicking. This label is mandatory, but you can call it anything. Examples include “bonus file,” “video,” and “affiliate links.”
- action – this is also mandatory. You need to specify a type of action that describes the event. Typically it will be something like “click” or “download.”
- opt_label – another label you can use to describe the event—optional.
- opt_value – how much you think this action is worth. Don’t include currency symbols: e.g., enter “5” for $5. This is an optional field.
- opt_noninteraction – if someone completes this event, you need to decide if you’d like it to affect the page’s bounce rate. If you do want it to affect it, enter “False”, otherwise, enter “True.”
Let’s pretend I had a bonus PDF of my best marketing tricks available for download. My event tracking code would look like this:
_trackEvent(‘lead magnet’, ‘download’, ‘marketing tricks’, 5, True)
But, this code by itself is useless. What you need to do is add it to an “onClick” property in a link’s URL. Unfortunately, there are some slight syntax differences, so you can’t just copy and paste.
I need to find the link to the PDF download and add the code:
<a href=”/downloads/marketing-tricks.pdf”onClick=”_gaq.push([‘_trackEvent’, ‘lead magnet’, ‘download’, ‘marketing tricks’, 5, false]);”>Download the Marketing Tricks PDF</a>
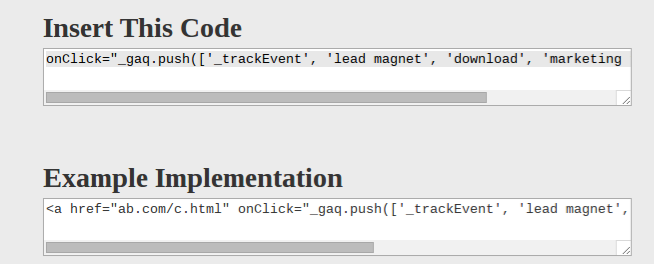
Make this easy with a code generator: If you’re not a huge fan of the technical stuff or having trouble remembering how to format the code correctly, you can use a GA event tracking code generator.
Just enter in the variables I explained above, and it will spit out the onClick code you can copy and paste into a link:
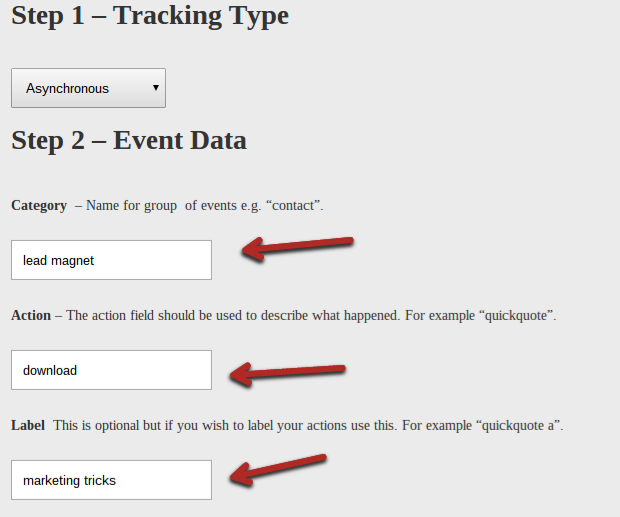
Once you’ve filled out the fields, you’ll get something like this:
3. Get a Visual Look into Your Visitors’ Actions with In-Page Analytics
What if you could see exactly what your visitors were doing on your pages?
That’d be pretty useful. You’d be able to see what parts of the content attracted their attention and which parts they didn’t really care for. You could use that information to optimize the user experience, which would lead to better conversions and more sales.
Well, that’s exactly what a heatmap software such as Crazy Egg does.
While it isn’t that expensive, I know that some website owners want to start with a more basic solution that doesn’t cost them anything. That solution is GA’s in-page analytics.
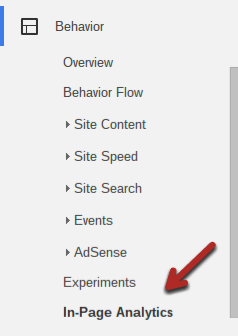
Option #1 – Use GA’s native in-page analytics: Start by navigating to “Behavior > In-Page Analytics”:
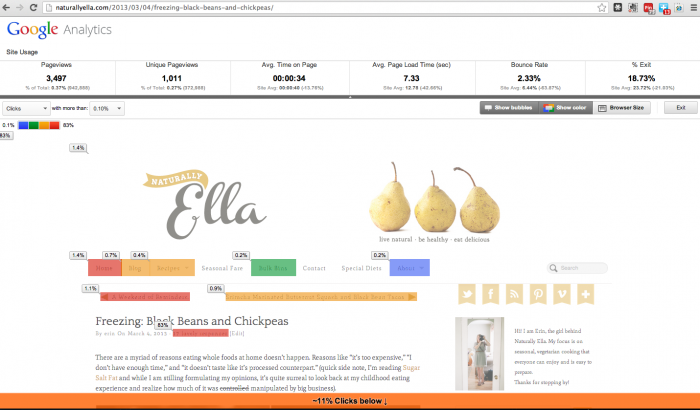
By default, it will show you your homepage with basic page metrics (pageviews, time on page, etc.), as well as bubbles over all the links. The bubbles show you the click-through rate for each destination URL (clicks divided by page views).

Pay close attention to what I just said there. The click-through rate is for each destination page. So, if you have four links to your contact page, they will all show the exact same percentage even though they probably got a different number of clicks. This is one of the main limitations of this feature.
You can explore other modes here. At the top right of the window, you can select “show color” or “browser size”:

The color option will highlight all the different links on the page, with the most clicked ones turning red and the least clicked ones turning blue. It’s the same information, just presented visually.
Next, the browser size option will show what a certain percentage of visitors see. When you drag the slider at the top, it will show you how much of your webpage that percentage of your visitors can see.
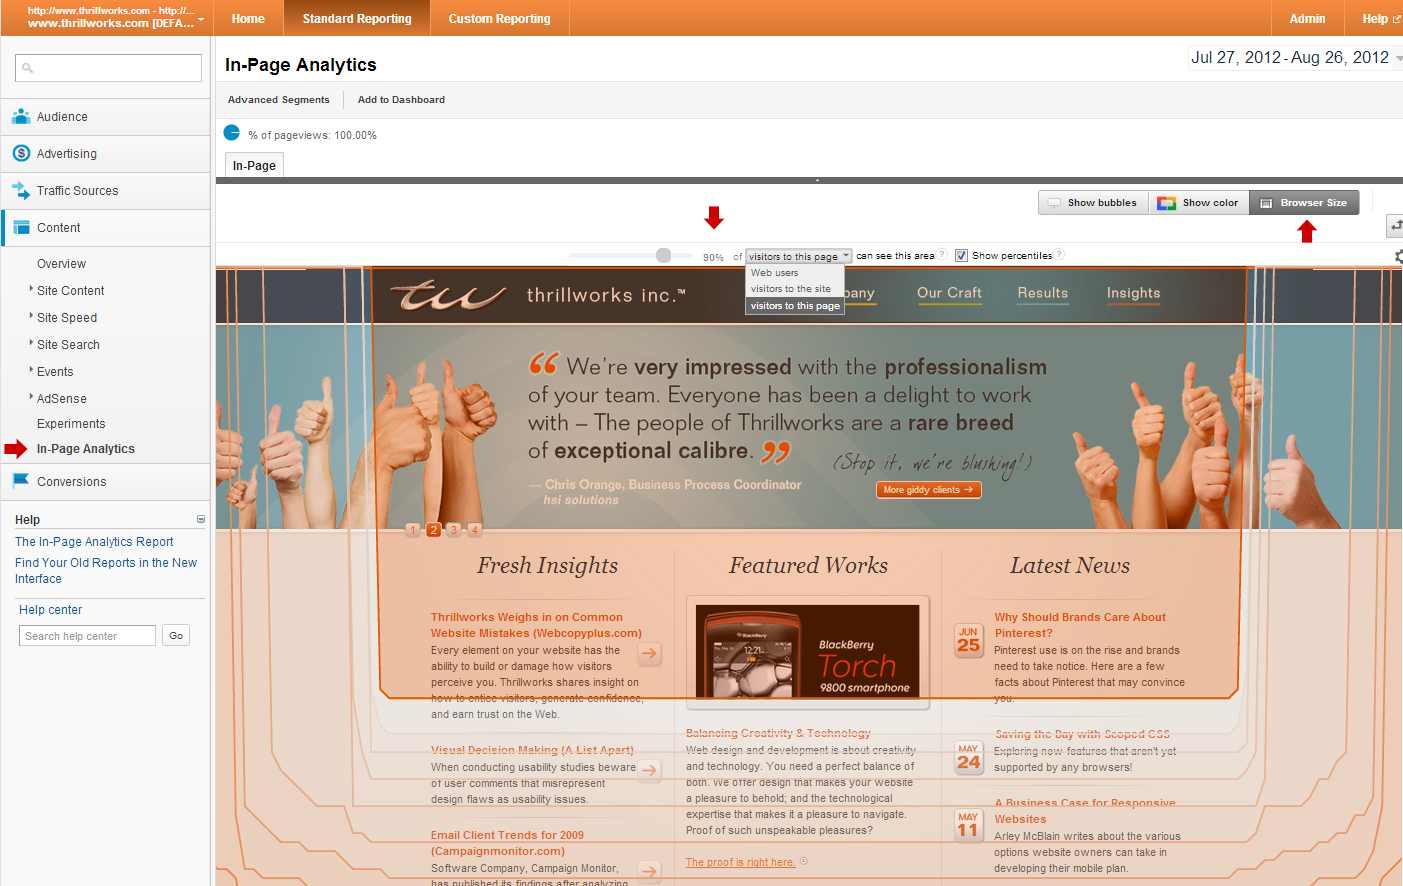
Ideally, all your key information should be visible to the vast majority of your visitors (90%+ on the slider).
You can navigate throughout your site using the links shown on the page and see engagement statistics for each page you visit.
But some pages are hard to navigate to, and that’s when you’d want to use an alternative way of getting to in-page analytics.
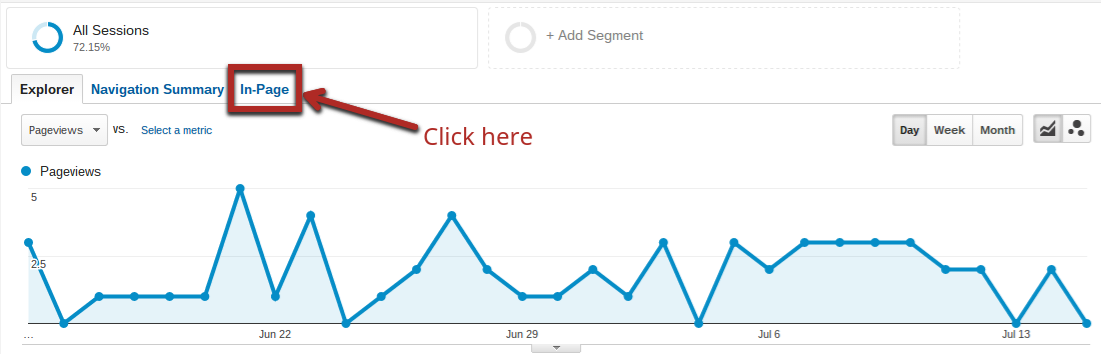
When you navigate to “Behavior > Site Content > All Pages”, you will see a list of pages, arranged by most to least visited.
When you click on a page, you will see an option for “In-Page” at the top of the traffic graph. When you click that tab, it will bring up the in-page analytics for that particular page.
Option #2 – Use the Chrome extension: If you use Google Chrome, you can install a really handy in-page analytics extension provided by Google.
One of the problems with using the native GA version is that it’s a little clunky. It’s not the easiest to navigate around to different pages of your site (or other sites in your account), and it doesn’t always render as expected.
With this extension, you just visit any page on your site (with your Google Analytics code in it) in your Chrome browser. You’ll see a map of your page, similar to the native GA version:
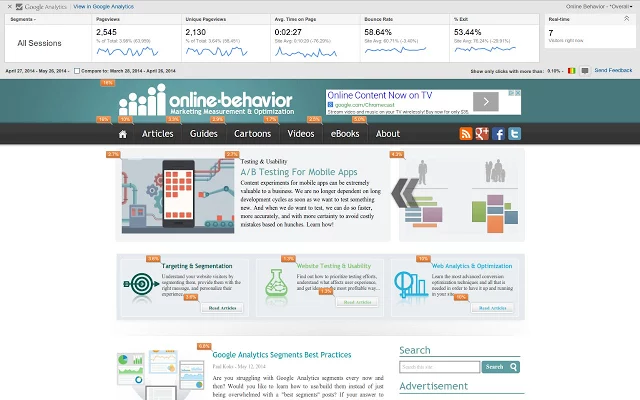
While it’s not the full version, you can always click on “View in Google Analytics” at the top left to open the full tab in GA.
4. The Real Power of Analytics is in Segmenting
When it comes to GA, most webmasters start and finish with overall traffic stats.
As anyone who has seriously worked on growing a website or conversion rate optimization will tell you, overall numbers are next to useless.
In order to see if your work is creating results, you need to dig deeper.
Segments are basically small pieces of a whole. In the context of GA, a segment allows you to look at your traffic and user stats through a particular lens. For example, you could segment by:
- Traffic source
- Device
- Browser
- Page
- Landing page
- Returning vs new visitors…
…and much more.
With GA, you can create advanced segments easily so that you can examine one particular segment. To make things even better, you can compare multiple segments at the same time.
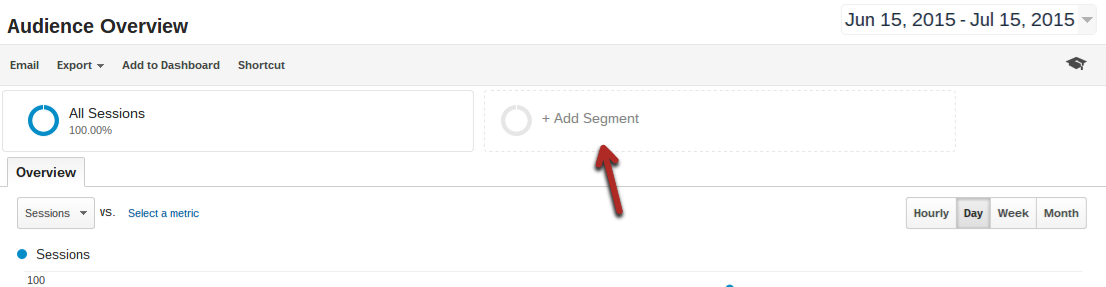
Creating advanced segments: When you first log in and select a site in GA, it will take you to “Audience > Overview”. This is one place where you can add segments, but you can add them in the exact same way in any Acquisition or Behavior section of GA as well.
Start by clicking the big “Add Segment” button:
That will bring up the following menu:
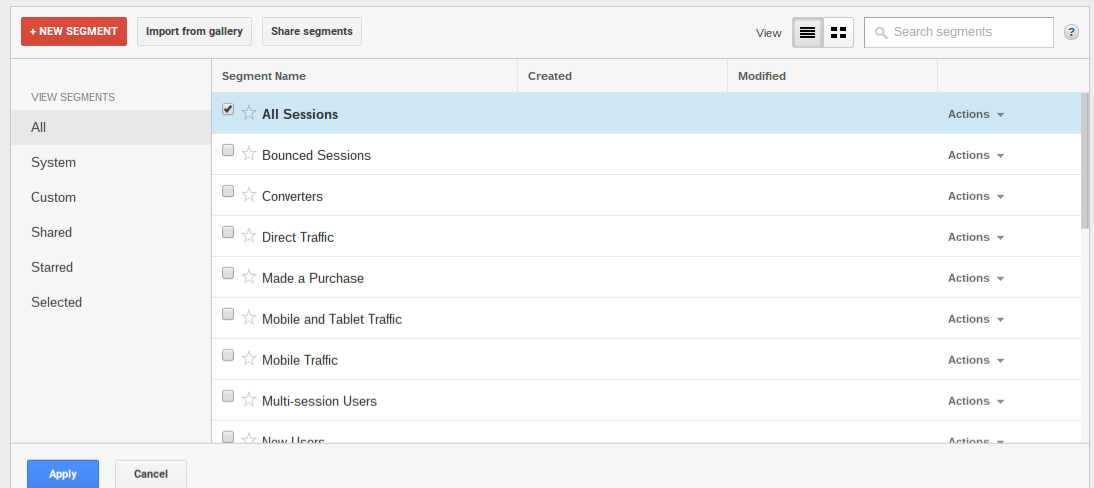
These are all the most common segments people choose, and there are some very useful ones.
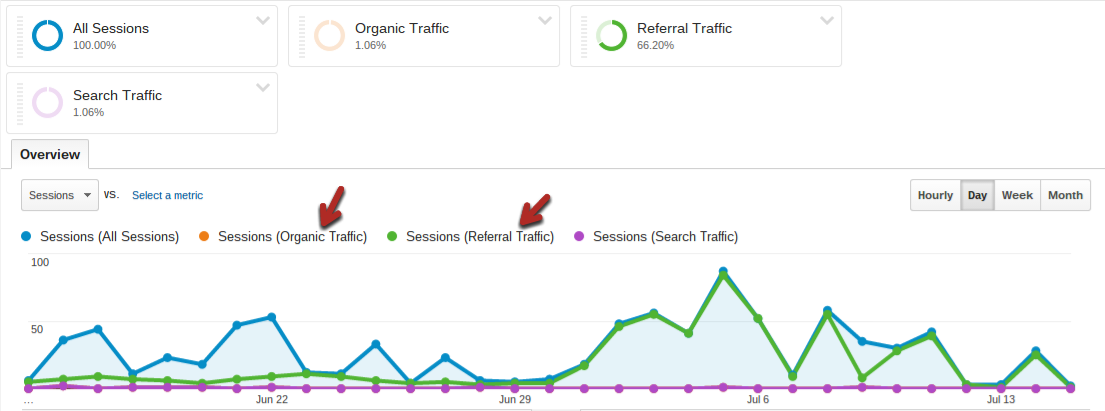
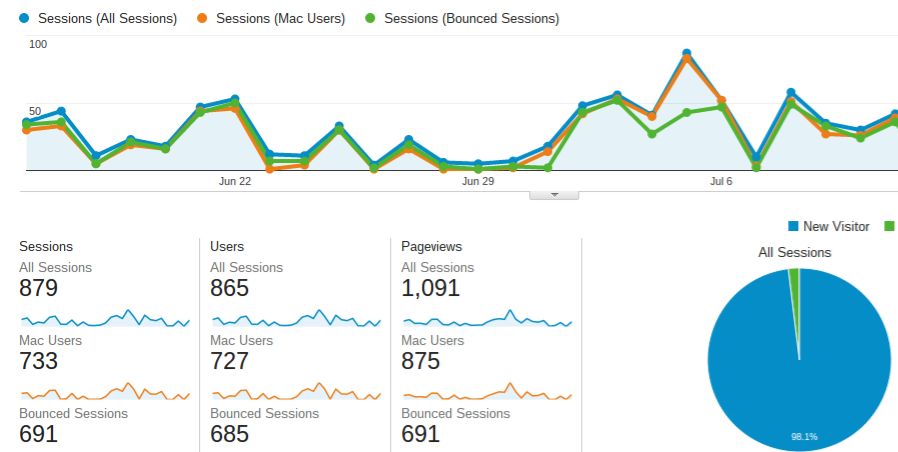
Check any that you’d like to see, and then click the Apply button in the bottom left. You’ll get an updated graph and stats with all segments that you have selected:
If you want to remove any, just click on the down arrow on each segment’s rectangle, and click “remove.”
But don’t think you’re limited to just those default segments. You can use advanced segments to quickly create segments for just about anything.
Click on “Add segment” again, but this time, click the big red button that says “+New Segment”.
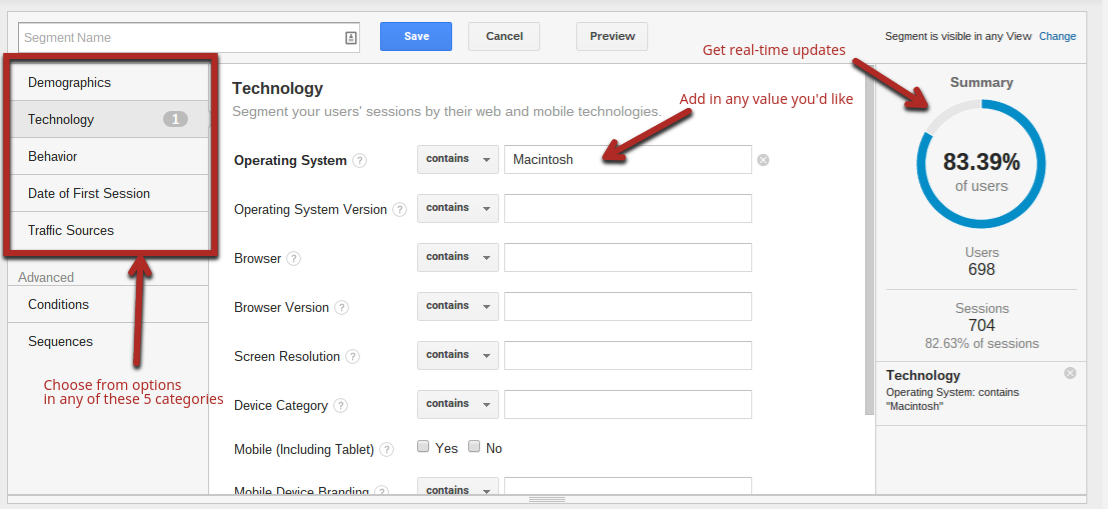
You can pick as many or as few options as you like. You have a virtually unlimited number of combinations.
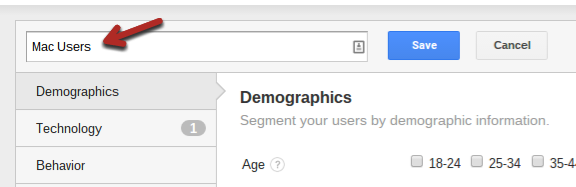
When you’re done, give it a name, and save the custom segment:
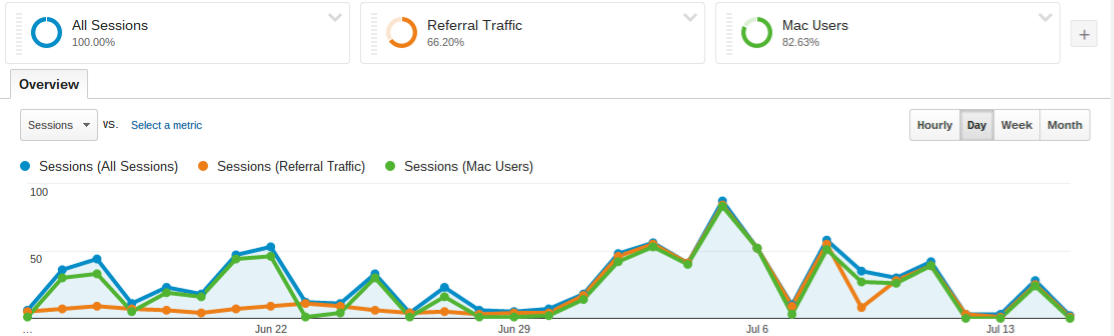
Once you save it, you will get an updated graph with your new segment included:
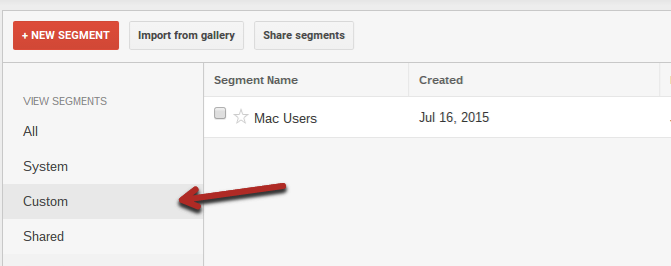
What’s really nice is that even if you remove that segment, you can always add a new one, click on “custom,” and re-add it without having to recreate it from scratch:
The best segments for you to create will depend on your specific business and what you’ve been testing and working on. Here is a great list of 16 of the best advanced segments.
5. Take Segments and Metrics Further with a Custom Dashboard or Shortcuts
Segments are really useful once you get used to them.
But there’s one problem…
Segments don’t save in reports, so you’ll have to re-add them every time you load GA, which is a waste of time (not to mention tedious).
Luckily, there are a few different ways to save your custom reports so you spend more of your time analyzing data and less time setting it up.
Creating a dashboard in GA: By default you get sent to your “Audience Overview”. While this is a useful report, you can create a report that combines the most important stats and metrics from all other reports, all on one screen.
It’s called a dashboard.
A dashboard is fully configurable so that you see only the data that is most useful to you. You can have up to 20 dashboards per account, which is more than enough for any site using GA.
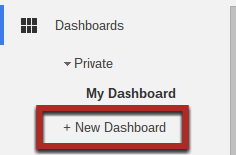
To get started, find the “Dashboards” icon and label on the left-hand side menu (near the top), expand it, and select “+ New Dashboard”
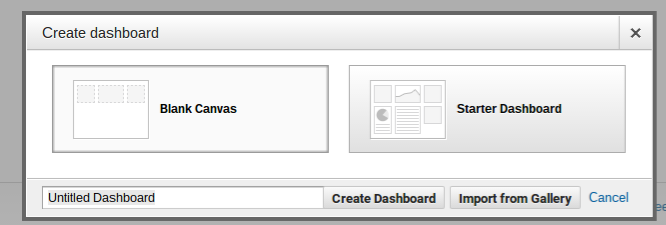
That will bring up a window with a few different options.
If you pick “Blank Canvas” you’ll start from scratch. Alternatively, you can choose “Starter Dashboard,” which gives you a few of the most commonly used widgets. If you’re just exploring, choose the second option.
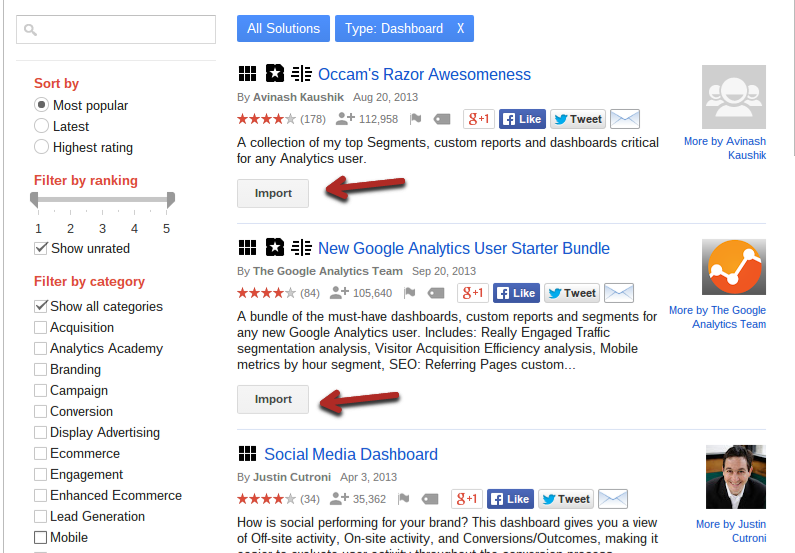
Finally, you’ll see an option to “Import from Gallery”. In a second, you’ll see that there are thousands of possible things to include in your dashboard. With this option, you can import a custom dashboard made by someone else to save some time.
If you choose the “Import from Gallery” option, you’ll get a list of the most popular published dashboards. Just click the “Import” button on the one you’d like to try:
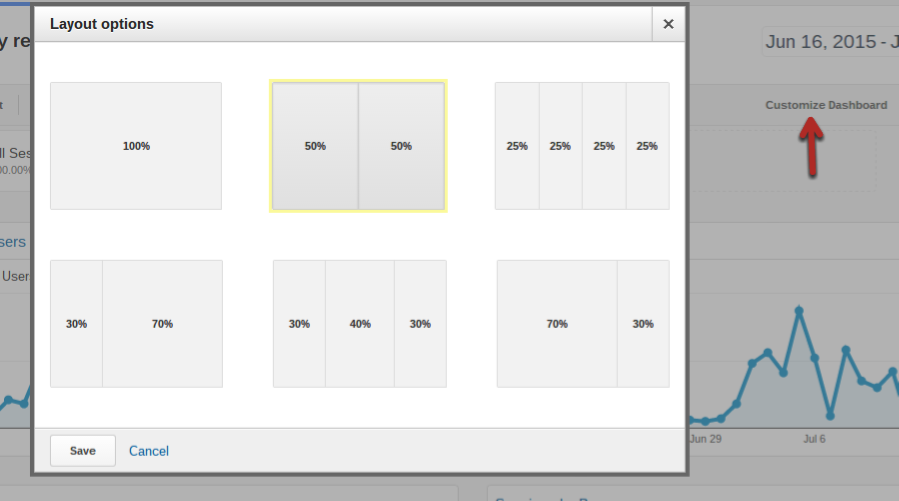
Once you pick one of the three options, you’ll see your initial dashboard. Now is the time to customize it to suit your needs and preferences.
If you click the “Customize Dashboard” button shown in the picture below, you can pick a custom layout. This could be useful if you have a particularly small or large screen.
Next, you’ll need to add a widget…
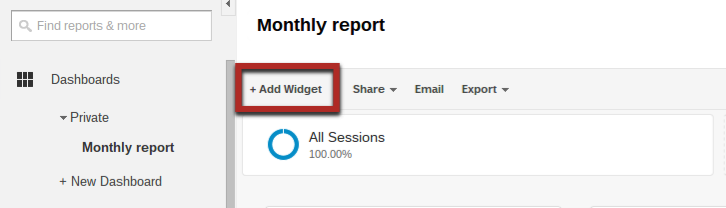
Dashboards consist solely of different widgets that you pick (although you can add advanced segments as well).
When you click “+ Add Widget”, you’ll get another pop-up:
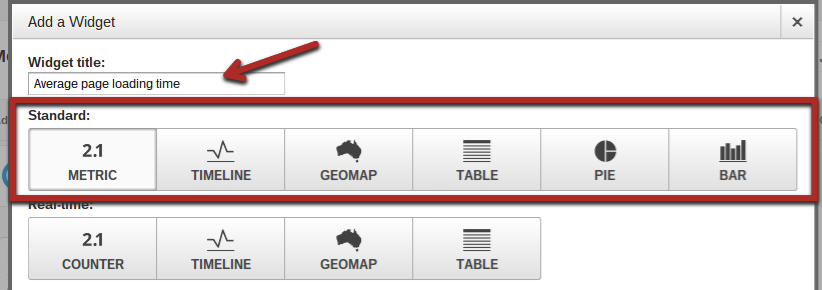
To start with, give your new widget a descriptive title.
After that, you need to decide which kind of widget you’d like to add. A standard widget takes a look at a pre-selected date range (like most of GA), while a real-time widget obviously looks at live metrics and data of people currently on your site.
Widgets fall under six different categories:
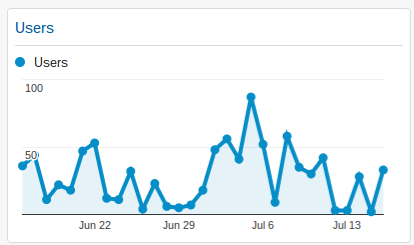
1. Metric – A metric is the standard small area you see on most reports in GA. It consists of a single number and a small thumbnail graph.
 2. Timeline – A timeline is a graph that plots your data over time.
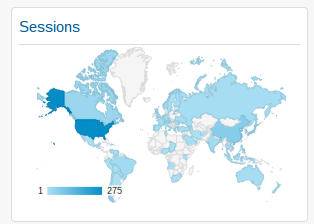
 3. Geomap – If you’re interested in data based on location, you can use a geomap. It’s a small map where areas with the highest amount of data are darkest.
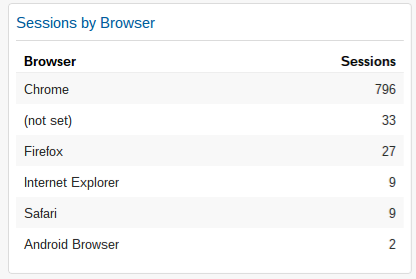
4. Table – A table compares metrics across different options. You can customize how many metrics are shown (e.g., sessions, bounce rate, etc.) as well as how many rows are included.
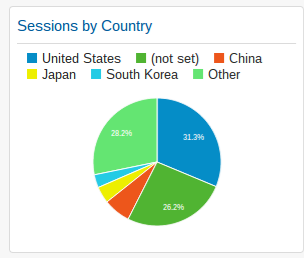
5. Pie – Everyone has seen a pie chart in GA. They’re good for quickly seeing the relative proportion of a few different groups of users (e.g., location, device, etc.).
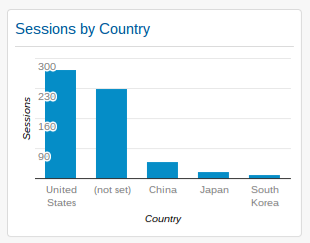
6. Bar – Many GA users don’t know they can also add bar graph widgets. You can configure all of the labels and settings as well as choose between vertical and horizontal bars.
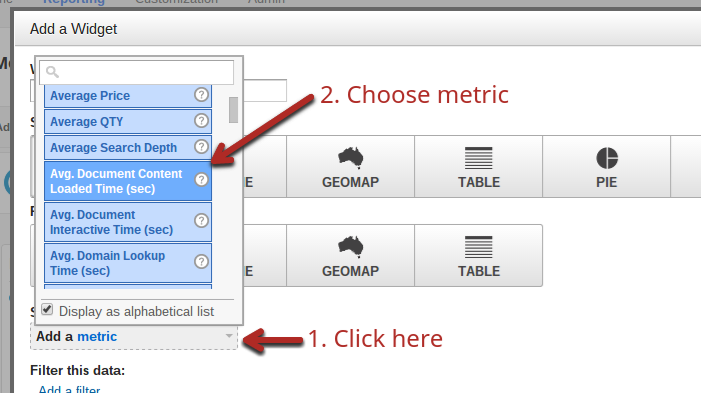
Once you choose the type of widget you’d like to add to your dashboard, click “Add a metric”.
That will bring up a long drop-down menu with just about every metric you could imagine. Find the one you’re looking for:
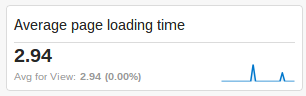
Once you’ve found what you’re looking for and have chosen the basic options you’d like for your widget, click the Save button in the bottom left, and you’ll see your updated dashboard.
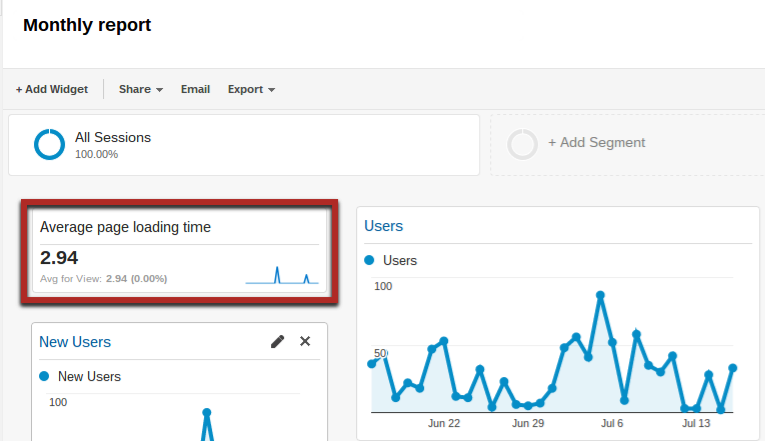
There it is!
Now, feel free to drag the panels around by clicking on and holding the top horizontal bar of each individual panel.
If you want to edit or get rid of any, just click the pencil—“edit”—button at the top of any panel:

Creating shortcuts in GA: Dashboards are great, but sometimes you need to really dig deep into a report or add segments for one.
It takes you a few minutes to drill down to the right area, add your dimensions, and then add any segments you’re interested in. The annoying part is that if you exit GA and come back, you have to do it all over again.
It’s a waste of time if you keep coming back to see the same reports.
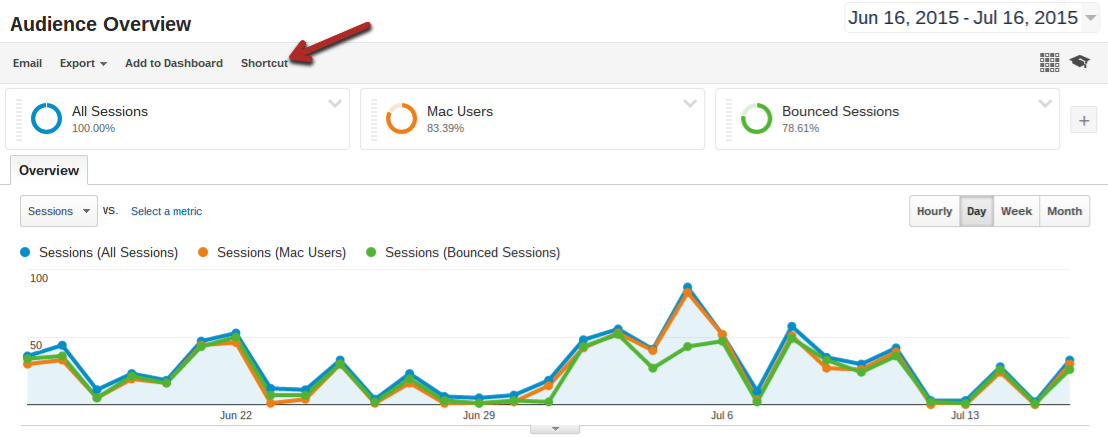
The next time you create a highly customized report, click on “Shortcut” at the top of the report. (Note you can also add it to a dashboard).
Give it a descriptive name, and press “Okay”.
That will save a shortcut to that report. Now, any time you load GA, you can look under the Shortcuts menu option to see the name of the report you just created.
In this example, it’s a “Customer Audience Overview”:
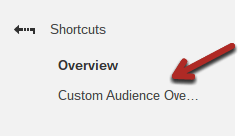
When I click it, guess what comes up?
That’s right, the exact same report I customized earlier.
If you find yourself going back to the same reports over and over again, create these shortcuts. They can save you hours per month of boring work.
6. Don’t Limit Yourself to Just Google Analytics Data
One of the great things about using Google products is that you can often tie all your data from different Google products together.
In Google Analytics, you can connect your Google Webmaster Tools account (Search Console) and get a ton of useful information.
Connecting your two accounts is really simple. Here’s a quick video that shows you how to do it:
Let’s look at why it’s useful to connect your WMT account with your GA account.
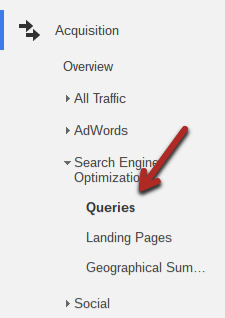
All of your WMT data is located under “Acquisition > Search Engine Optimization”.
The main useful feature is the “Queries” tab:
A few years ago, GA itself was a great source of SEO information. You were able to see which keywords were providing most of your traffic.
Over time, however, more and more of that information became limited. Eventually, almost all keyword data from Google shifted to not provided.
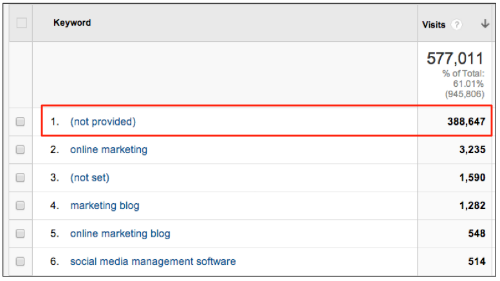
While it didn’t exactly happen overnight, GA is no longer useful for most SEO data.
What most site owners did instead was use data from WMT. Although it’s a different set of data altogether, with its own limitations, it’s the best simple alternative you have.
But it’s kind of a pain switching back and forth between GA and WMT for all your site properties. Once you integrate them, you won’t need to.
First up is the query report.
In this section, you’ll see up to 1,000 of the top queries for your site. Along with the queries, you’ll get the number of impressions and clicks for each query as well as their average SERP position and click-through rate.
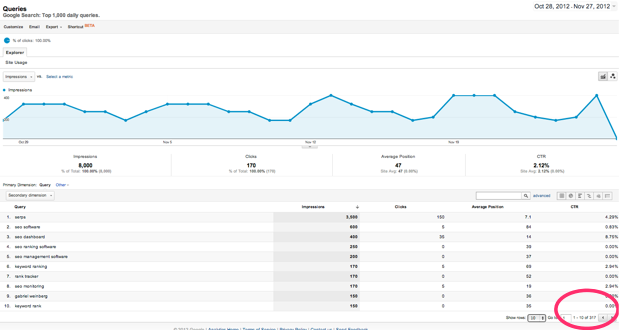
One nice thing is that it looks exactly like any other report in GA, and it functions the same way.
This data has lots of uses, but the one I would like to highlight is being able to find the best opportunities for gaining traffic.
It’s no secret that almost all search engine traffic goes to the top few results. The number 1 result alone gets about 33% of that traffic overall, and in some cases much higher.
Therefore, it makes sense to spend time improving the rank of pages for queries that are just below the top results.
An easy way to identify these queries is in this tab with advanced filters.
First, click the “advanced” link right beside the search bar in the middle of the page. This will open some custom filter options:
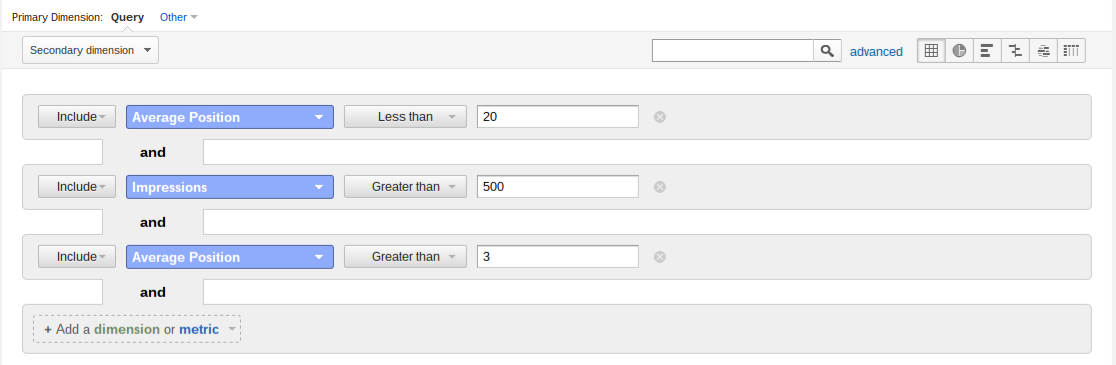
I recommend adding the following filters:
- “Average Position” greater than 3 – There’s not too much of a point optimizing for a query if you already rank in the top 3 although you could change this to 2 or 1.
- “Average Position” less than 20 – You need to pick an upper limit so that you only get those keywords that you can get into the top few results with minimal effort. You could pick 20 as an upper limit to start with, but if you have many results, lower it to 15 or 10.
- “Impressions” greater than X – If a query gets no impressions, it’s likely not worth ranking for. “X” will vary depending on your niche’s competition, your experience, and your resources. I recommend using at least 100 for this filter.
There’s one more useful tab that contains WMT data that you can use: “Landing Pages”.
When you click on it, you’ll get a similar report, but this time in terms of pages, not queries:
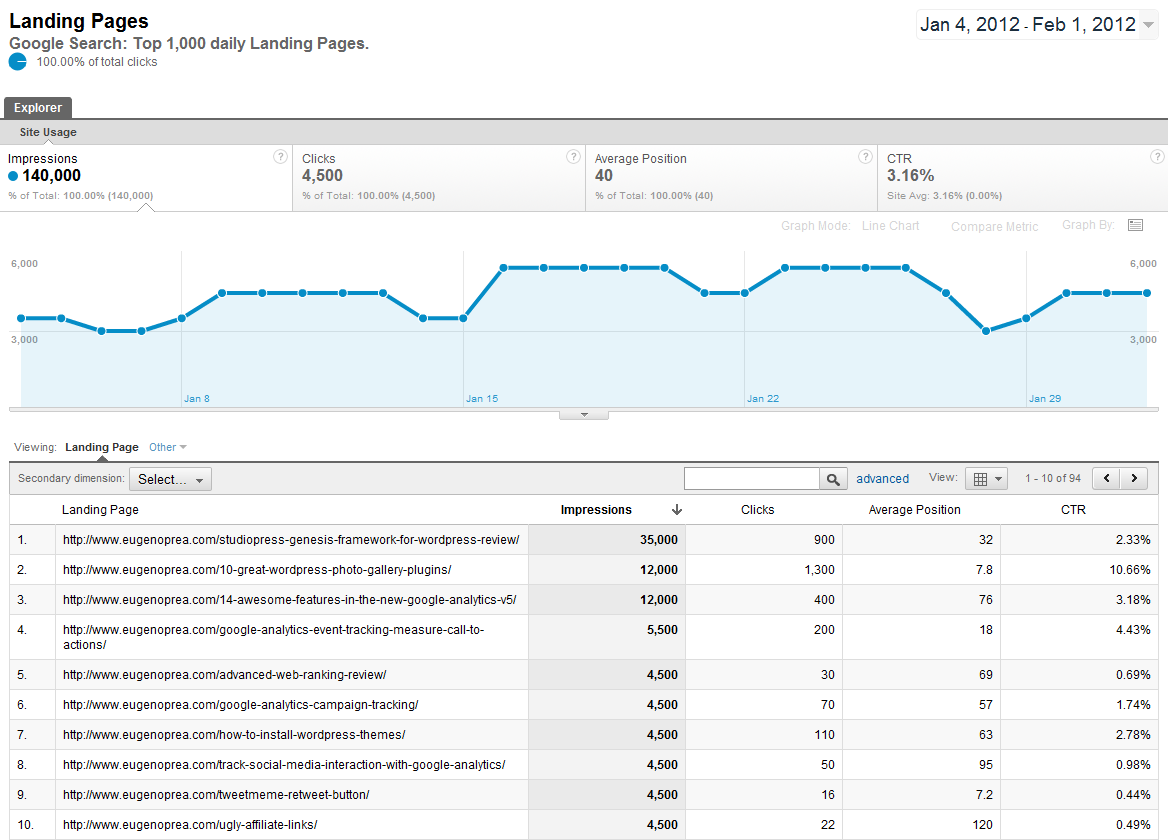
The reason why this report is useful is because it tells you which pages Google trusts the most—the pages with the most impressions.
It also tells you the average position and click-through rate each page gets in the SERPs. The better the position, the better your CTR should be.
There are two main things you can do with this data:
- Target new long-tail keywords for pages that get a lot of impressions – If they are already highly trusted pages, you should be able to rank for long-tail keywords just by adding them to the page in a few places.
- Identify abnormally low click-through rates – If the page’s average position is on the first page but its CTR is less than a few percent, there’s something wrong. Consider writing a more enticing title and meta description and adding structured data if possible.
Conclusion
Analytics software enables you to track how your work impacts your site.
Instead of guessing how the changes you implement affect your users, you can test them and back up those changes with hard data.
If you use the six advanced GA tricks in this article, you’ll be able to not only gain more insight into your site’s user experience but also do it without wasting your time.
If you found these tricks interesting, don’t stop here. As I said at the beginning, GA has tons of great features—many are more useful than the ones I was able to cover here.
If you have a favorite GA feature, share it with me and everyone else in the comments below.
[“source-searchenginejournal”]
